Farm Mapping
We fly RTK drones, set GNSS ground control where accuracy matters, process the imagery and draw the layers you need on top. The results are reliable to centimetre level, so you can measure paddocks, drains and fence lines with confidence. Below are some example outputs, but there's no limit to the possibilities, so get in touch about the information you want to see.
Five example layers
Real layers from a recent Taranaki dairy farm job of close to 100 hectares — a 3 cm drone orthomosaic, LiDAR terrain and a pre-flight base map. Each answers a different on-farm question.
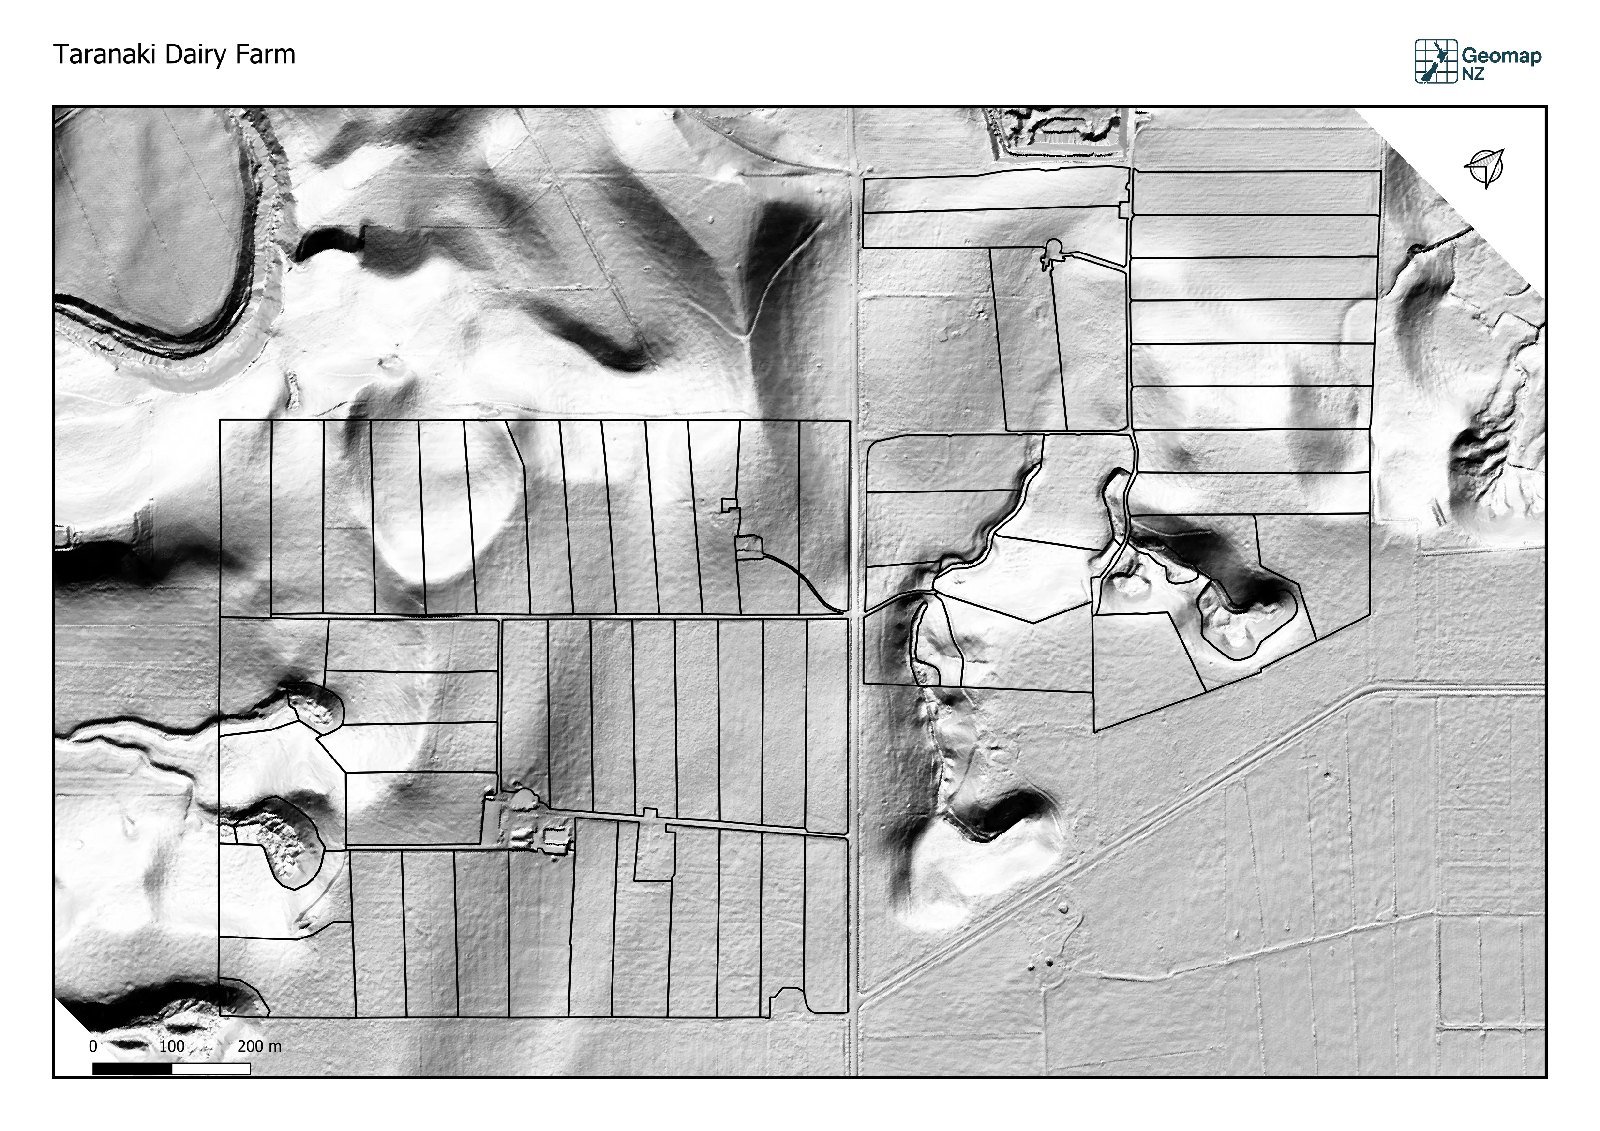
Terrain from LiDAR — a greyscale hillshade of the farm with the paddock boundaries drawn on. Old river terraces, gullies and subtle ridges stand out, which helps with drainage and earthworks decisions.
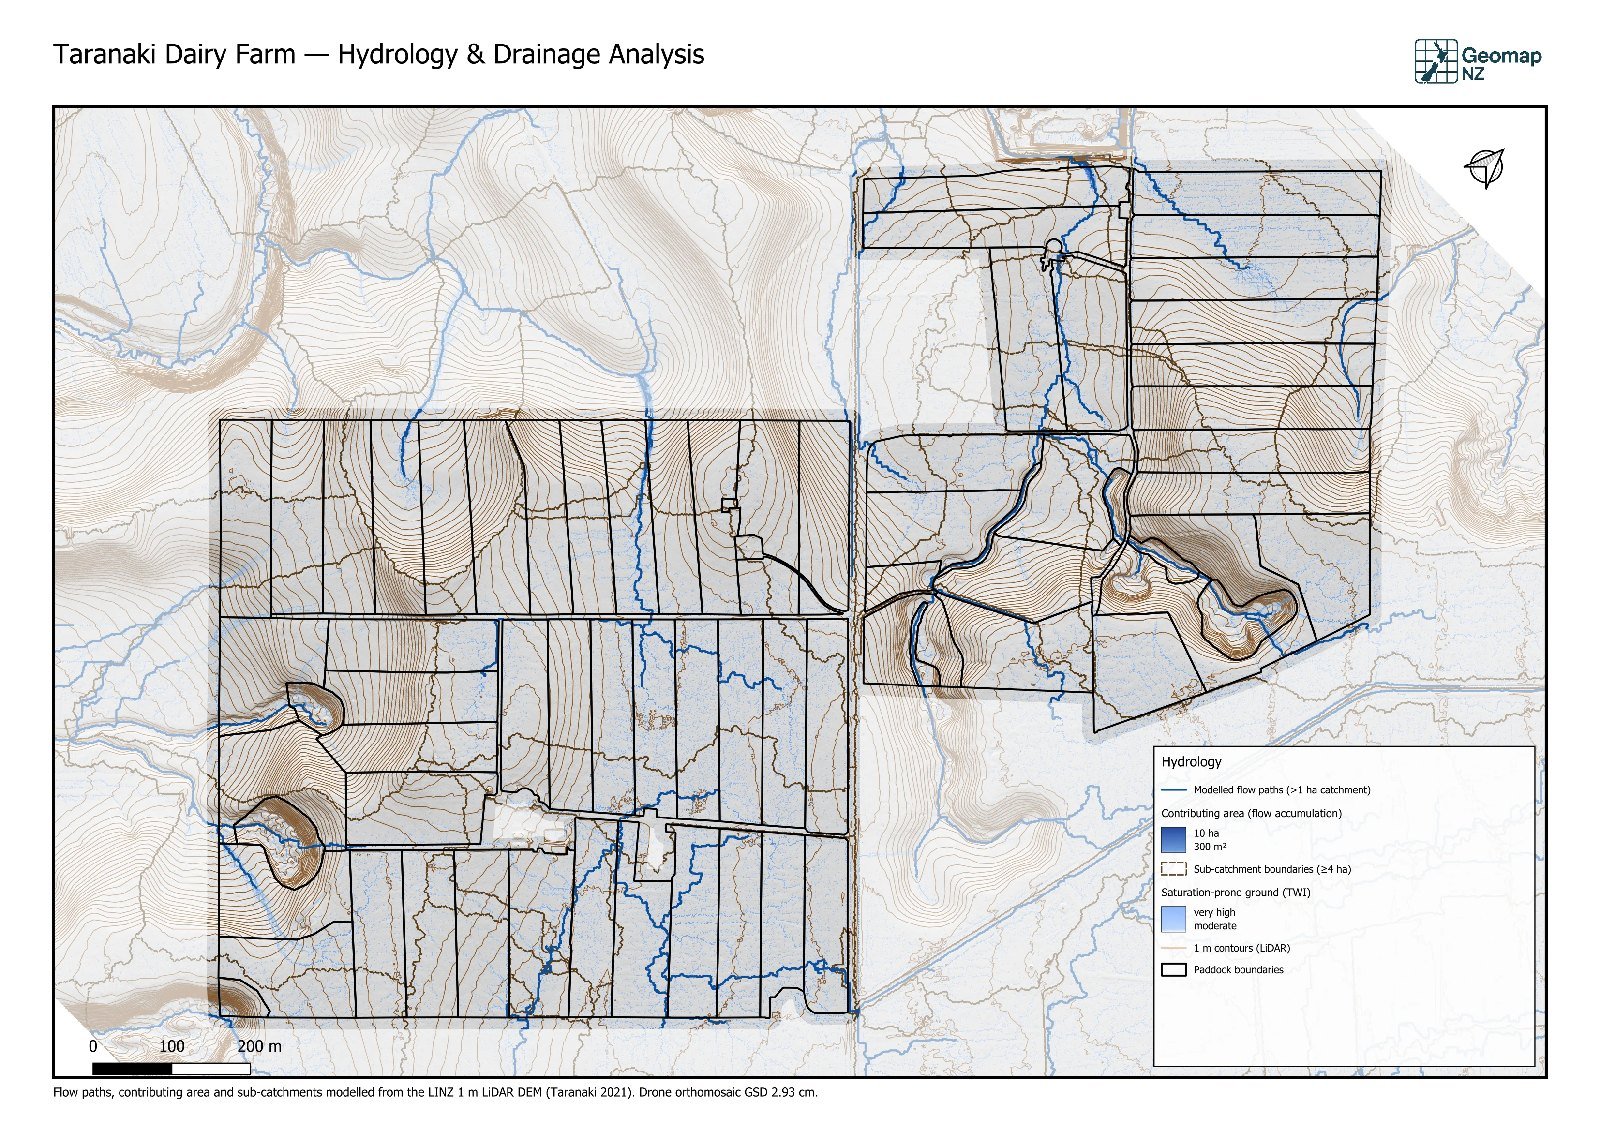
Hydrology and drainage — modelled flow paths, catchment areas and saturation-prone ground from the 1 m LiDAR. Shows where water runs and pools, so you can put drains, culverts and fencing in the right place.
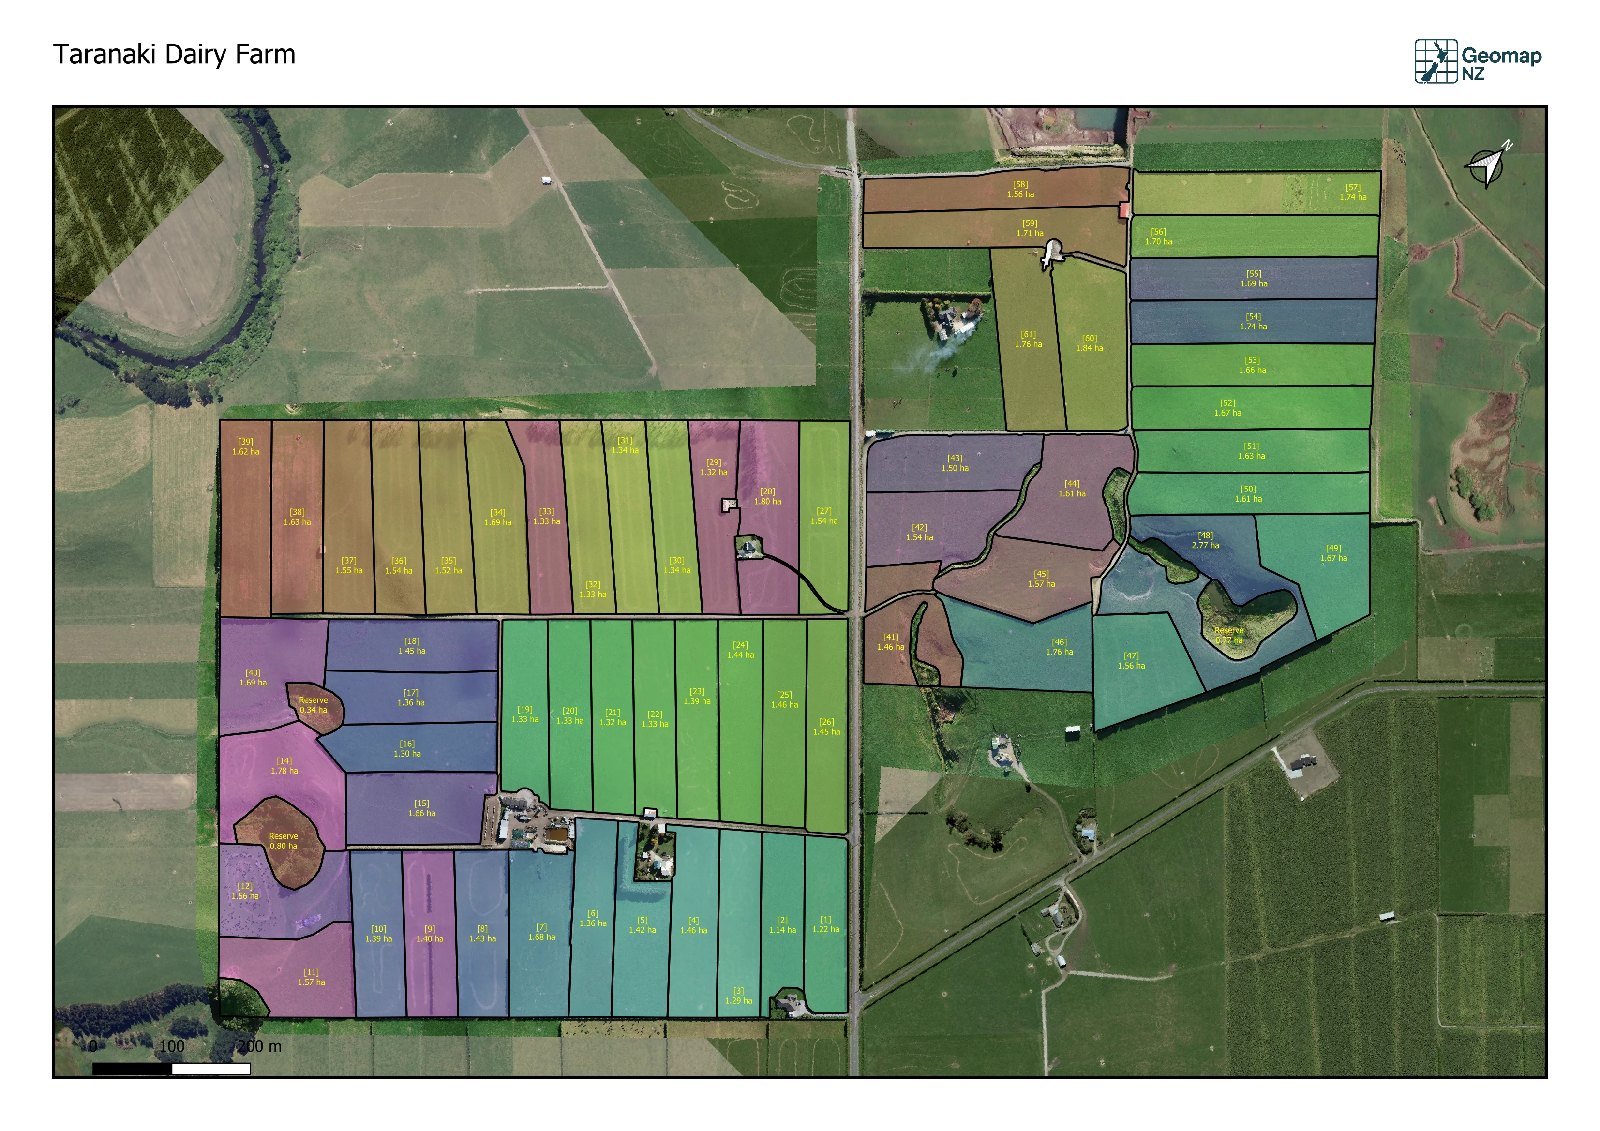
Paddock map — all 61 paddocks over the drone orthomosaic, colour-coded and labelled with number and area, like [22] 1.33 ha. A useful record for planning and for day-to-day farm decisions.
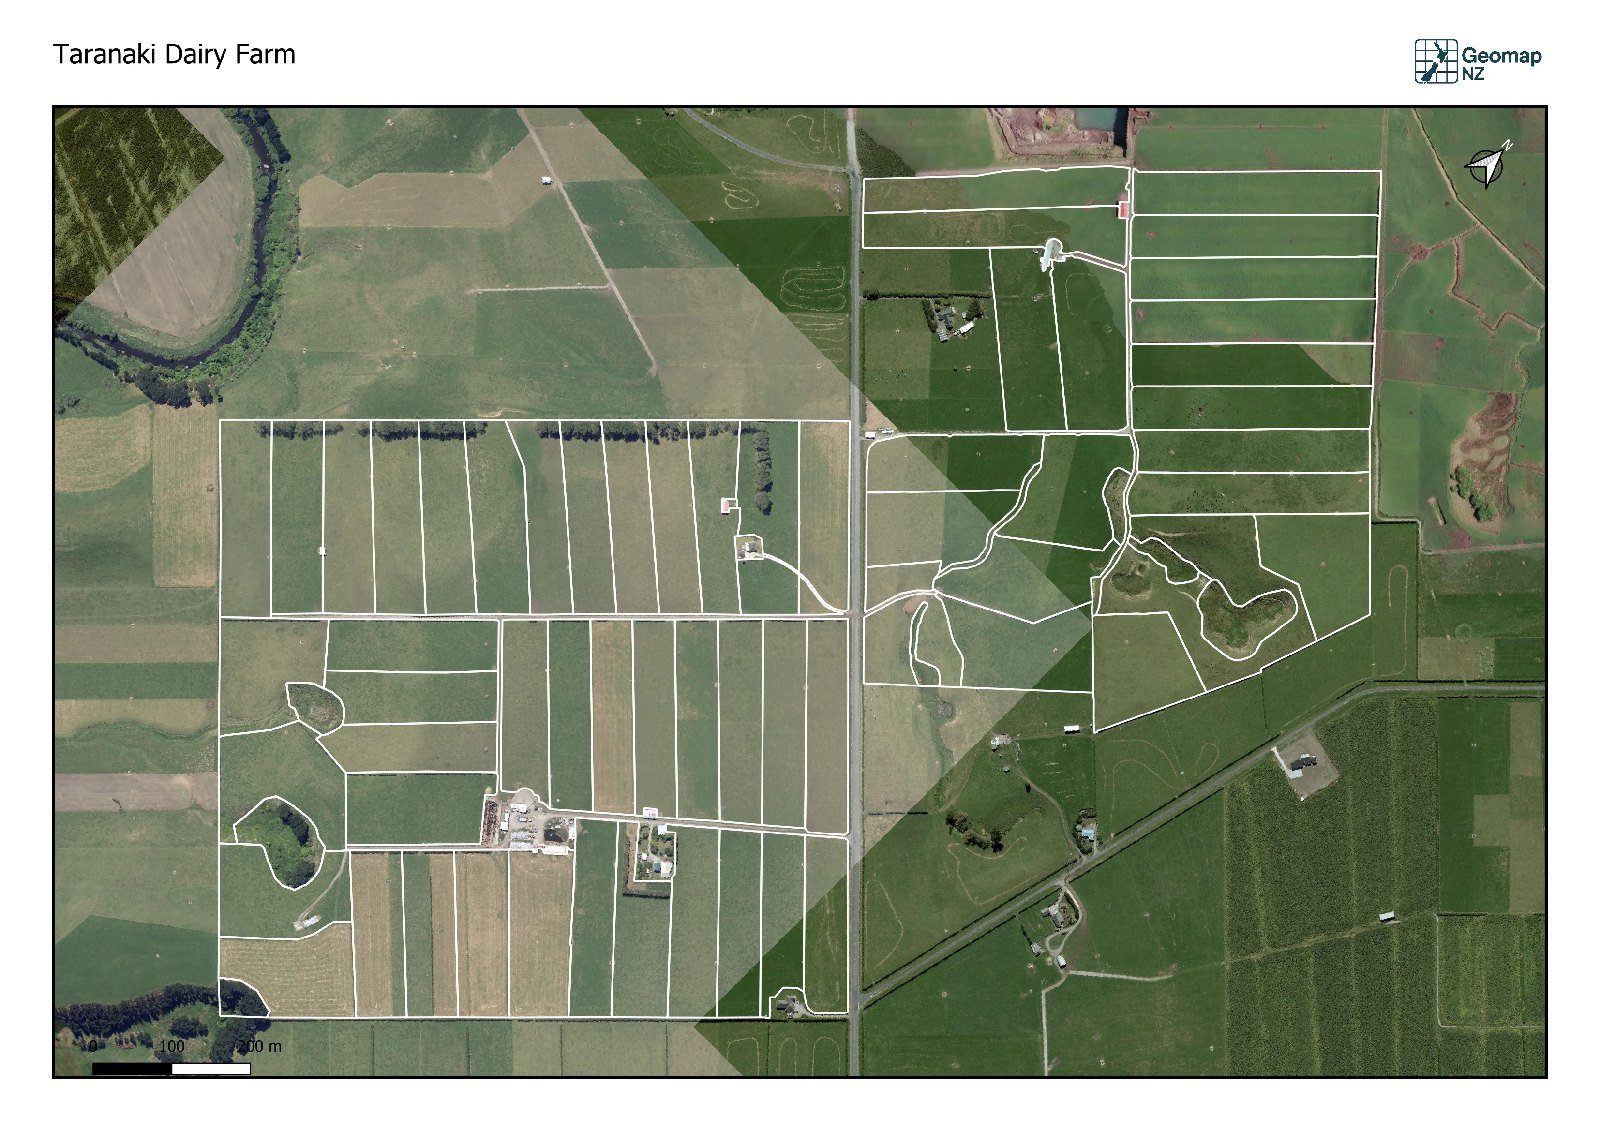
Paddock boundaries over public aerial imagery — a quick base map you can make before any drone flight. The drone sheets above it are what make the measurements trustworthy.
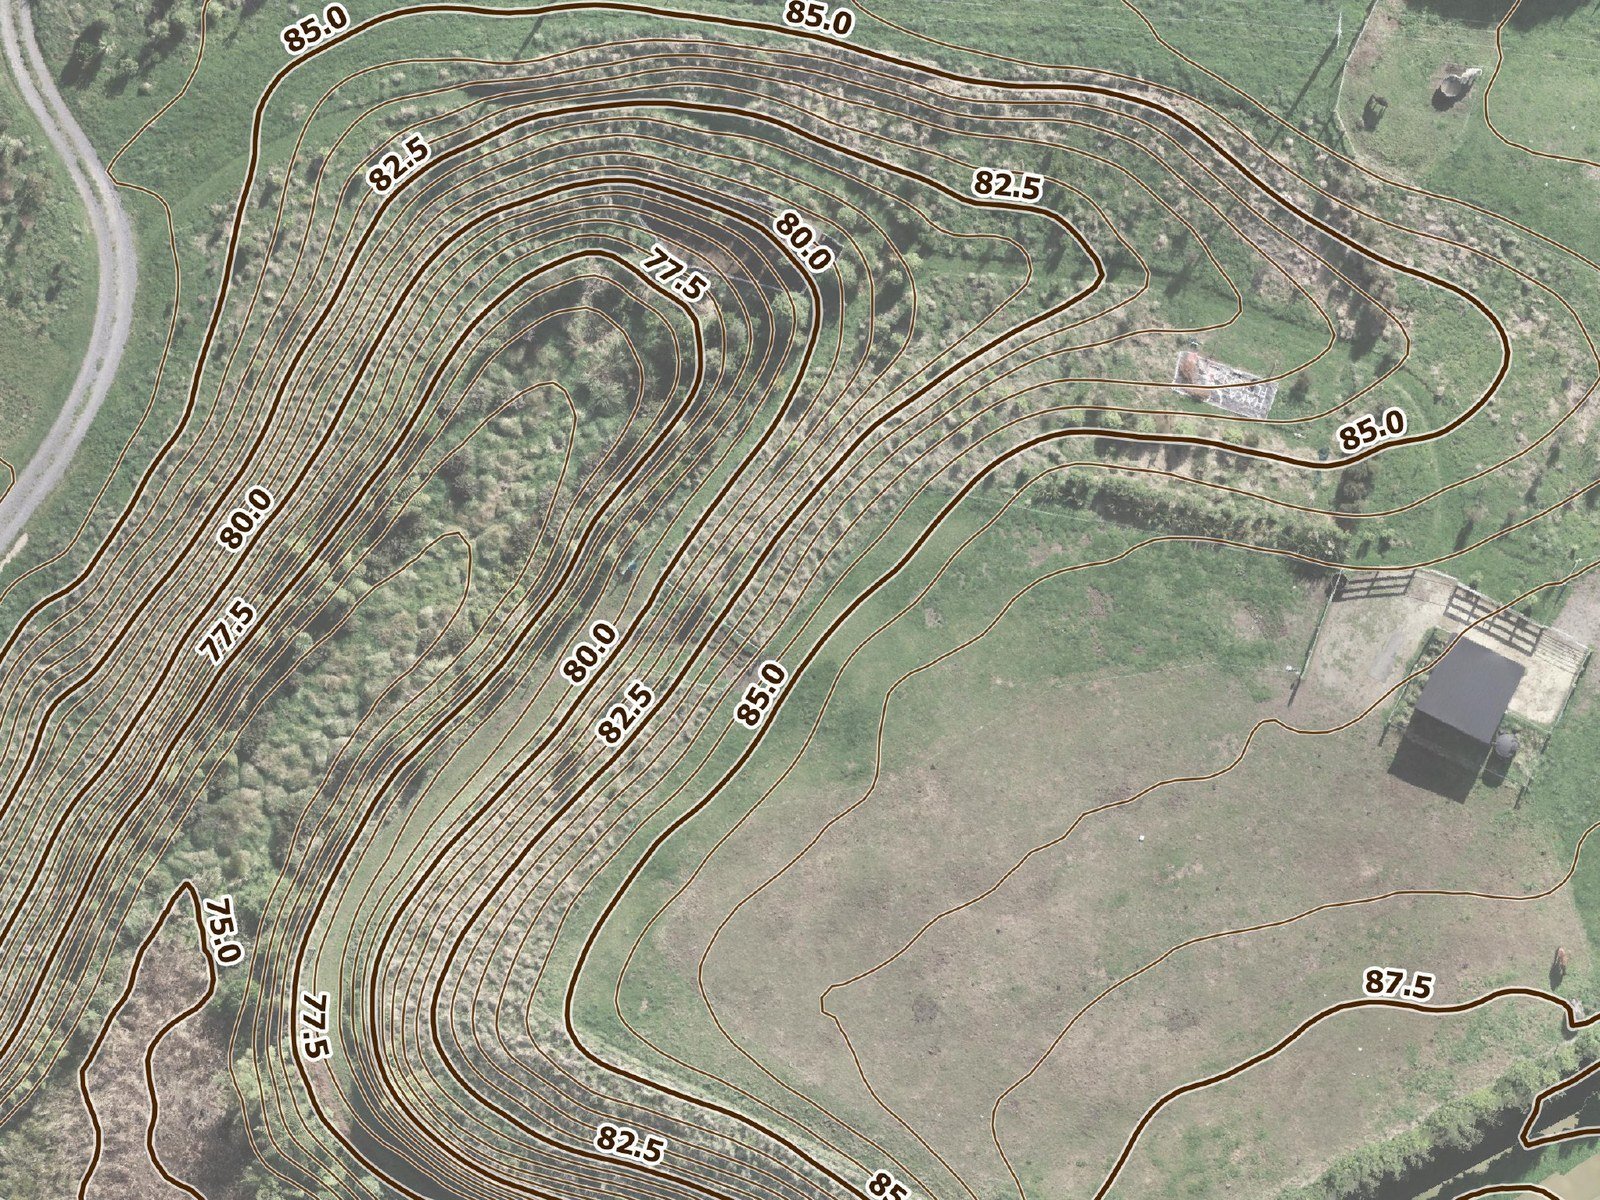
Contours, close up — half-metre contour lines, labelled every 2.5 m, over our drone image of a Taranaki lifestyle block. Slope and fall at a glance, for drainage, tracks and earthworks. Heights come from the LINZ LiDAR ground model (CC BY 4.0).
Want to map your farm?
Send us your farm details and we will get the drone in the air.